How to Perform a Lifecycle Cost Analysis for a Circulating Fluidized Bed Boiler
Circulating Fluidized Bed (CFB) boilers are valued for their fuel flexibility, low emissions, and high combustion efficiency, making them ideal for industrial and power generation applications. However, due to their complex design and higher capital cost, evaluating a CFB boiler solely on upfront pricing can be misleading. To understand the true economic impact, plant owners must perform a Lifecycle Cost Analysis (LCCA)—a comprehensive approach that assesses both initial investment and long-term operational costs.
To perform a lifecycle cost analysis for a CFB boiler, calculate all costs incurred over its expected life, including capital investment, installation, fuel supply, bed material consumption, emissions control systems, maintenance, labor, and decommissioning. You should also estimate the system’s expected performance, fuel flexibility benefits, and cost savings from regulatory compliance. The analysis should result in key financial indicators such as Total Cost of Ownership (TCO), Net Present Value (NPV), and Payback Period to inform investment decisions.
Below is a structured framework for conducting a thorough LCCA on a CFB boiler system.
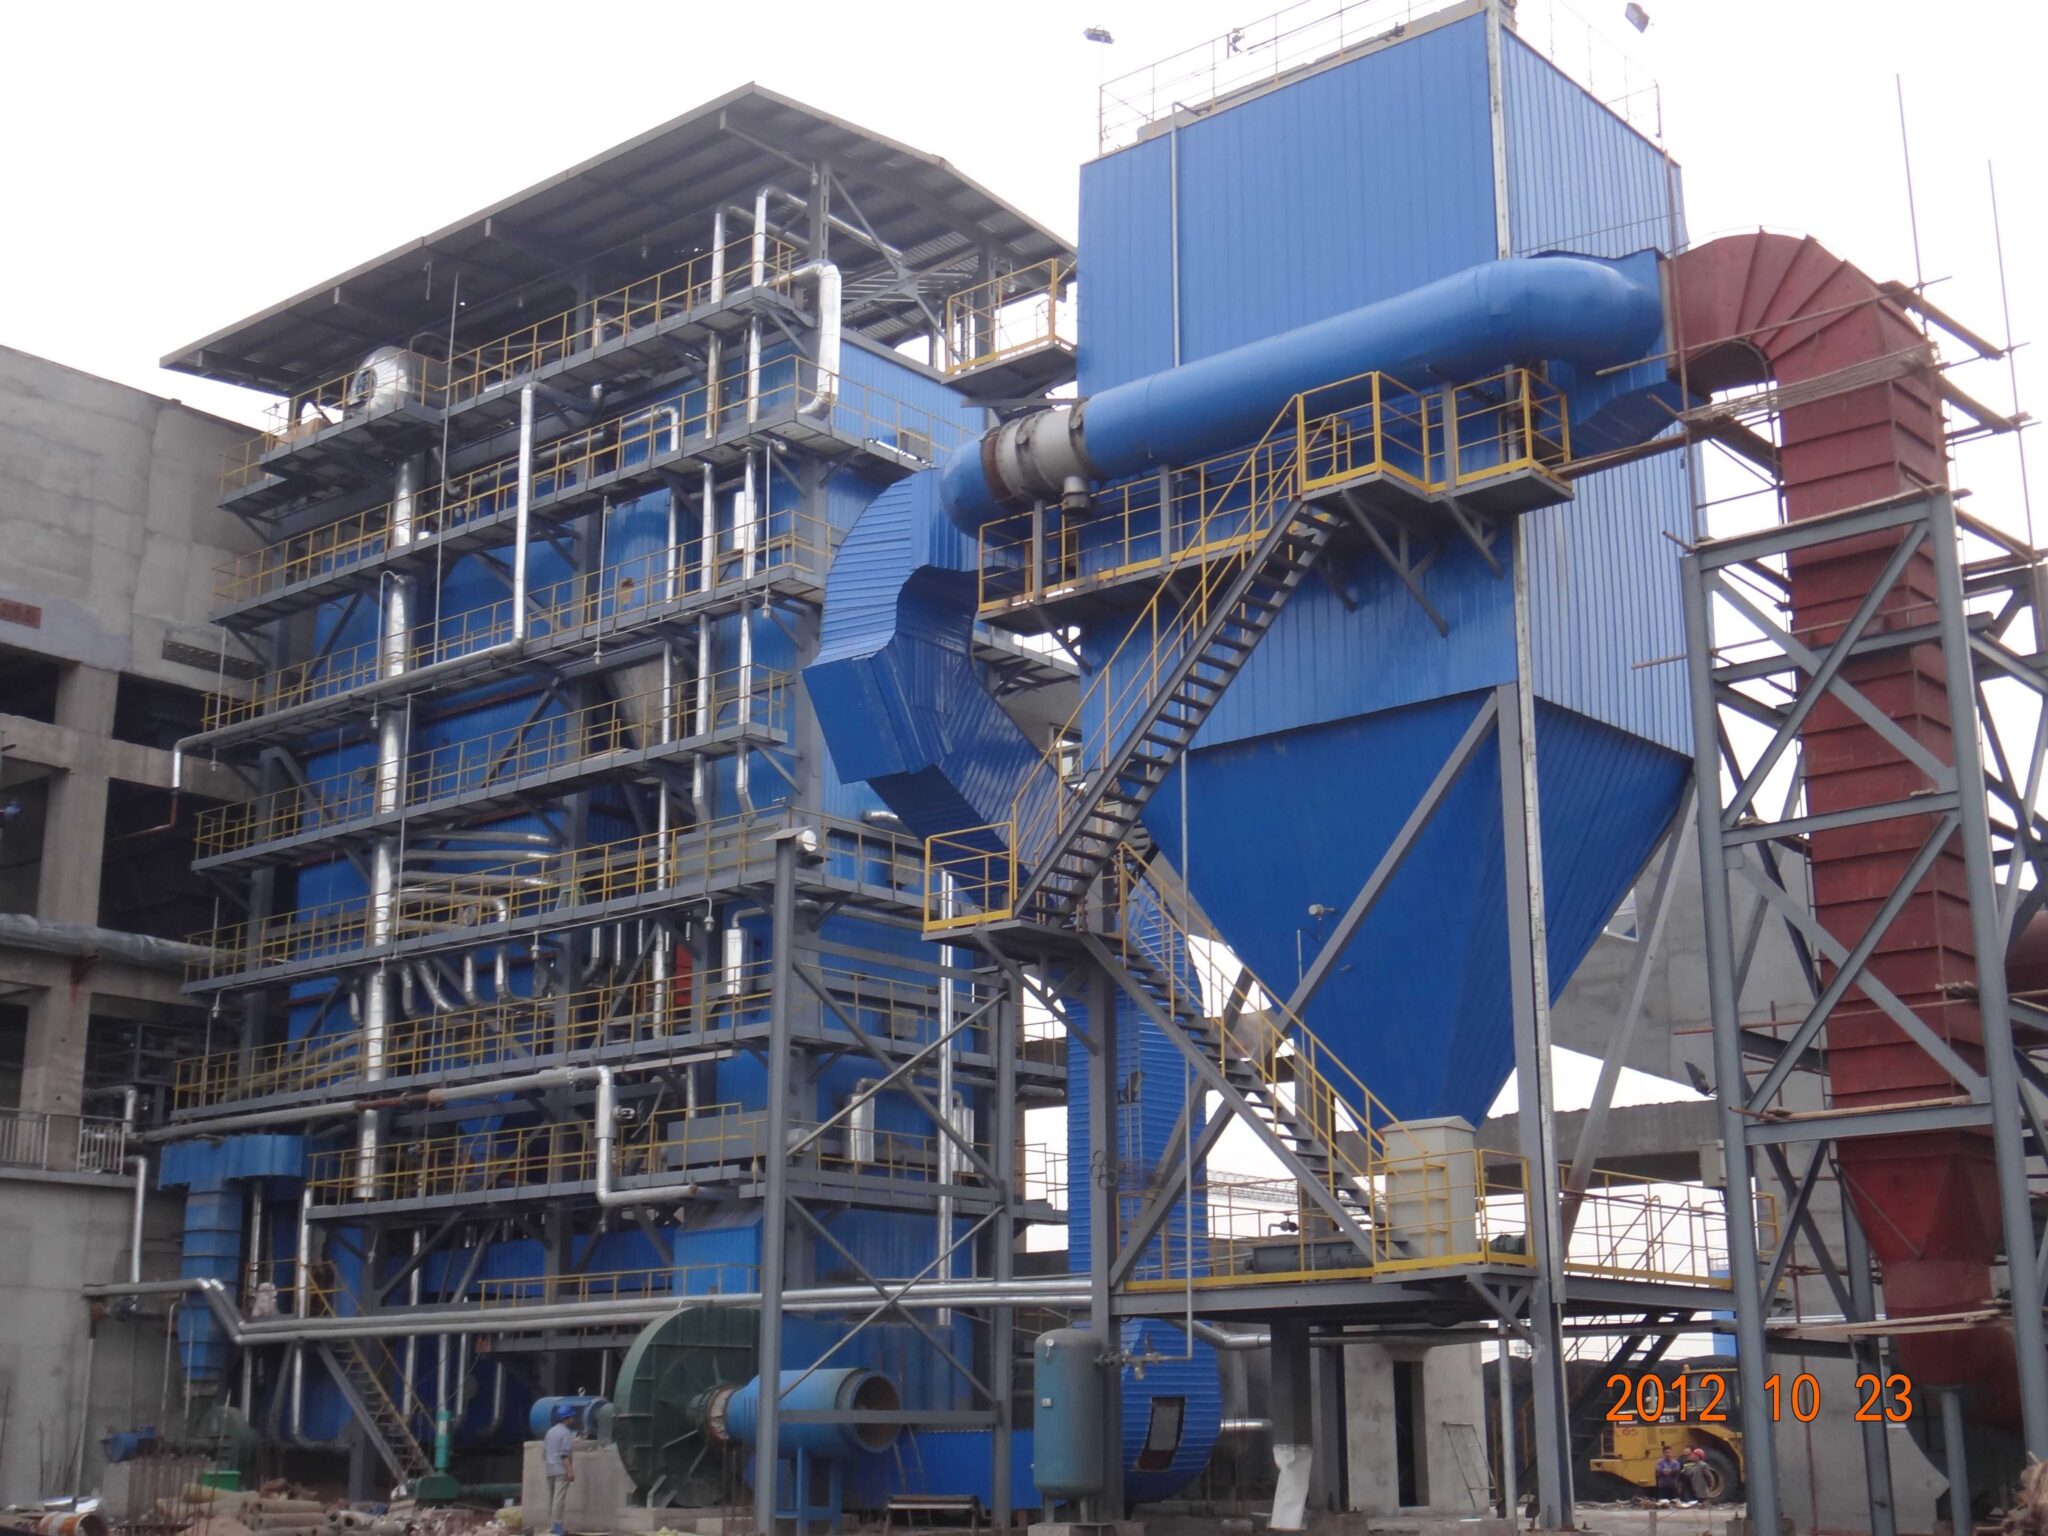
What Is Lifecycle Cost Analysis (LCCA) and Why Is It Important for CFB Boiler Investments?
Circulating Fluidized Bed (CFB) boilers are widely valued for their fuel flexibility, lower NOₓ emissions, and excellent thermal efficiency. However, CFB systems are also complex, with high capital costs and unique operational requirements—such as bed material management, fuel classification, and emissions control. When considering a CFB boiler investment, it’s not enough to look at initial price or capacity. A comprehensive financial decision requires Lifecycle Cost Analysis (LCCA)—a tool that captures total cost of ownership (TCO) and long-term value.
Lifecycle Cost Analysis (LCCA) is a financial evaluation method that calculates all costs associated with owning, operating, maintaining, and decommissioning a CFB boiler over its service life. It includes capital investment, fuel costs, bed material replacement, maintenance, labor, emissions control, downtime losses, and residual value. LCCA is important for CFB boiler investments because it reveals the true economic impact over 20–30 years and allows comparisons with other technologies or fuel strategies. This helps power plant operators make financially sound, risk-aware decisions.
Initial savings can be deceptive—the real cost is what you’ll pay to own and run the system for decades.
Lifecycle cost analysis provides a full picture of economic performance for CFB boiler projects by including all operating and capital costs over time.True
CFB boilers have complex O&M and fuel dynamics that require long-term analysis beyond CAPEX.
📦 What’s Included in Lifecycle Cost Analysis for CFB Boilers?
| Cost Category | Description |
|---|---|
| CAPEX (Capital Investment) | Boiler, auxiliaries, installation, automation systems |
| Fuel Cost & Delivery | Coal, biomass, petcoke, or blends + logistics |
| Bed Material | Sand or limestone replacement and management |
| Maintenance & Overhauls | Parts, labor, annual outages, refractory repair |
| Water & Treatment | Feedwater systems, softening, chemical dosing |
| Emissions Control | Bag filters, SNCR, flue gas scrubbers, permit compliance |
| Labor & Monitoring | Operators, control room staff, maintenance engineers |
| Downtime & Performance Losses | Cost of lost generation due to outages |
| Decommissioning/Residual Value | End-of-life dismantling or resale |
LCCA captures both fixed and variable costs over a 20–30 year operational horizon.
🧮 Sample 20-Year LCCA for 50 MW CFB Boiler
| Cost Element | Estimate (USD) |
|---|---|
| CAPEX (Turnkey) | $28 million |
| Fuel & Transportation | $70 million |
| Bed Material Replacement | $4.5 million |
| Maintenance & Labor | $12 million |
| Emissions Compliance | $6 million |
| Water & Chemicals | $2 million |
| Downtime/Forced Outages | $3.5 million |
| Decommissioning | $1 million |
| Total LCCA (20 Years) | ~$127 million |
Compare with a PC (pulverized coal) boiler LCCA: ~$135–145 million due to higher emissions cost and lower fuel flexibility.
📊 Cost Breakdown by Percentage
| Cost Component | % of Total LCCA |
|---|---|
| Fuel & Logistics | 55–60% |
| Maintenance & Labor | 10–12% |
| Emissions Compliance | 5–8% |
| Bed Material | 3–5% |
| CAPEX | 20–25% |
Fuel and maintenance are the largest drivers of total ownership cost.
📈 Why LCCA Matters for CFB Investments
| Reason | Explanation |
|---|---|
| Evaluates long-term financial feasibility | Includes hidden operational expenses |
| Allows comparison with alternative boiler types | Supports CAPEX vs. OPEX tradeoffs |
| Quantifies fuel strategy impact | Helps choose between biomass, coal, blends |
| Reveals ROI and payback period | Assists with investment risk modeling |
| Supports finance and funding decisions | Helps justify grants, green bonds, or loans |
LCCA helps CFB boiler investors accurately forecast fuel savings, emissions cost reductions, and long-term operating budgets.True
It captures operational flexibility and compliance savings that don't appear in upfront bids.
📋 Key Considerations for Accurate LCCA Modeling
| Input/Variable | Why It’s Critical |
|---|---|
| Fuel Cost Escalation Rate | Reflects future volatility |
| Annual Operating Hours | Drives fuel, wear, and revenue values |
| Load Variability | Affects efficiency and bed material usage |
| Emissions Regulations Forecast | Influences compliance costs |
| Discount Rate (NPV modeling) | Adjusts future value to present terms |
| Expected Equipment Life | Determines asset amortization |
A good LCCA is both technical and financial, involving engineers and accountants.
Summary
Lifecycle Cost Analysis (LCCA) is essential for intelligent CFB boiler investment planning, capturing the full cost spectrum over 20–30 years—from construction to decommissioning. Unlike surface-level bids that only show CAPEX, LCCA includes fuel trends, emissions fees, maintenance cycles, and performance losses, providing decision-makers with a realistic picture of financial sustainability. In a world of fluctuating energy markets and tightening environmental policy, the winners are those who plan not just for startup—but for the full lifecycle. LCCA is how you turn combustion technology into an economic asset.
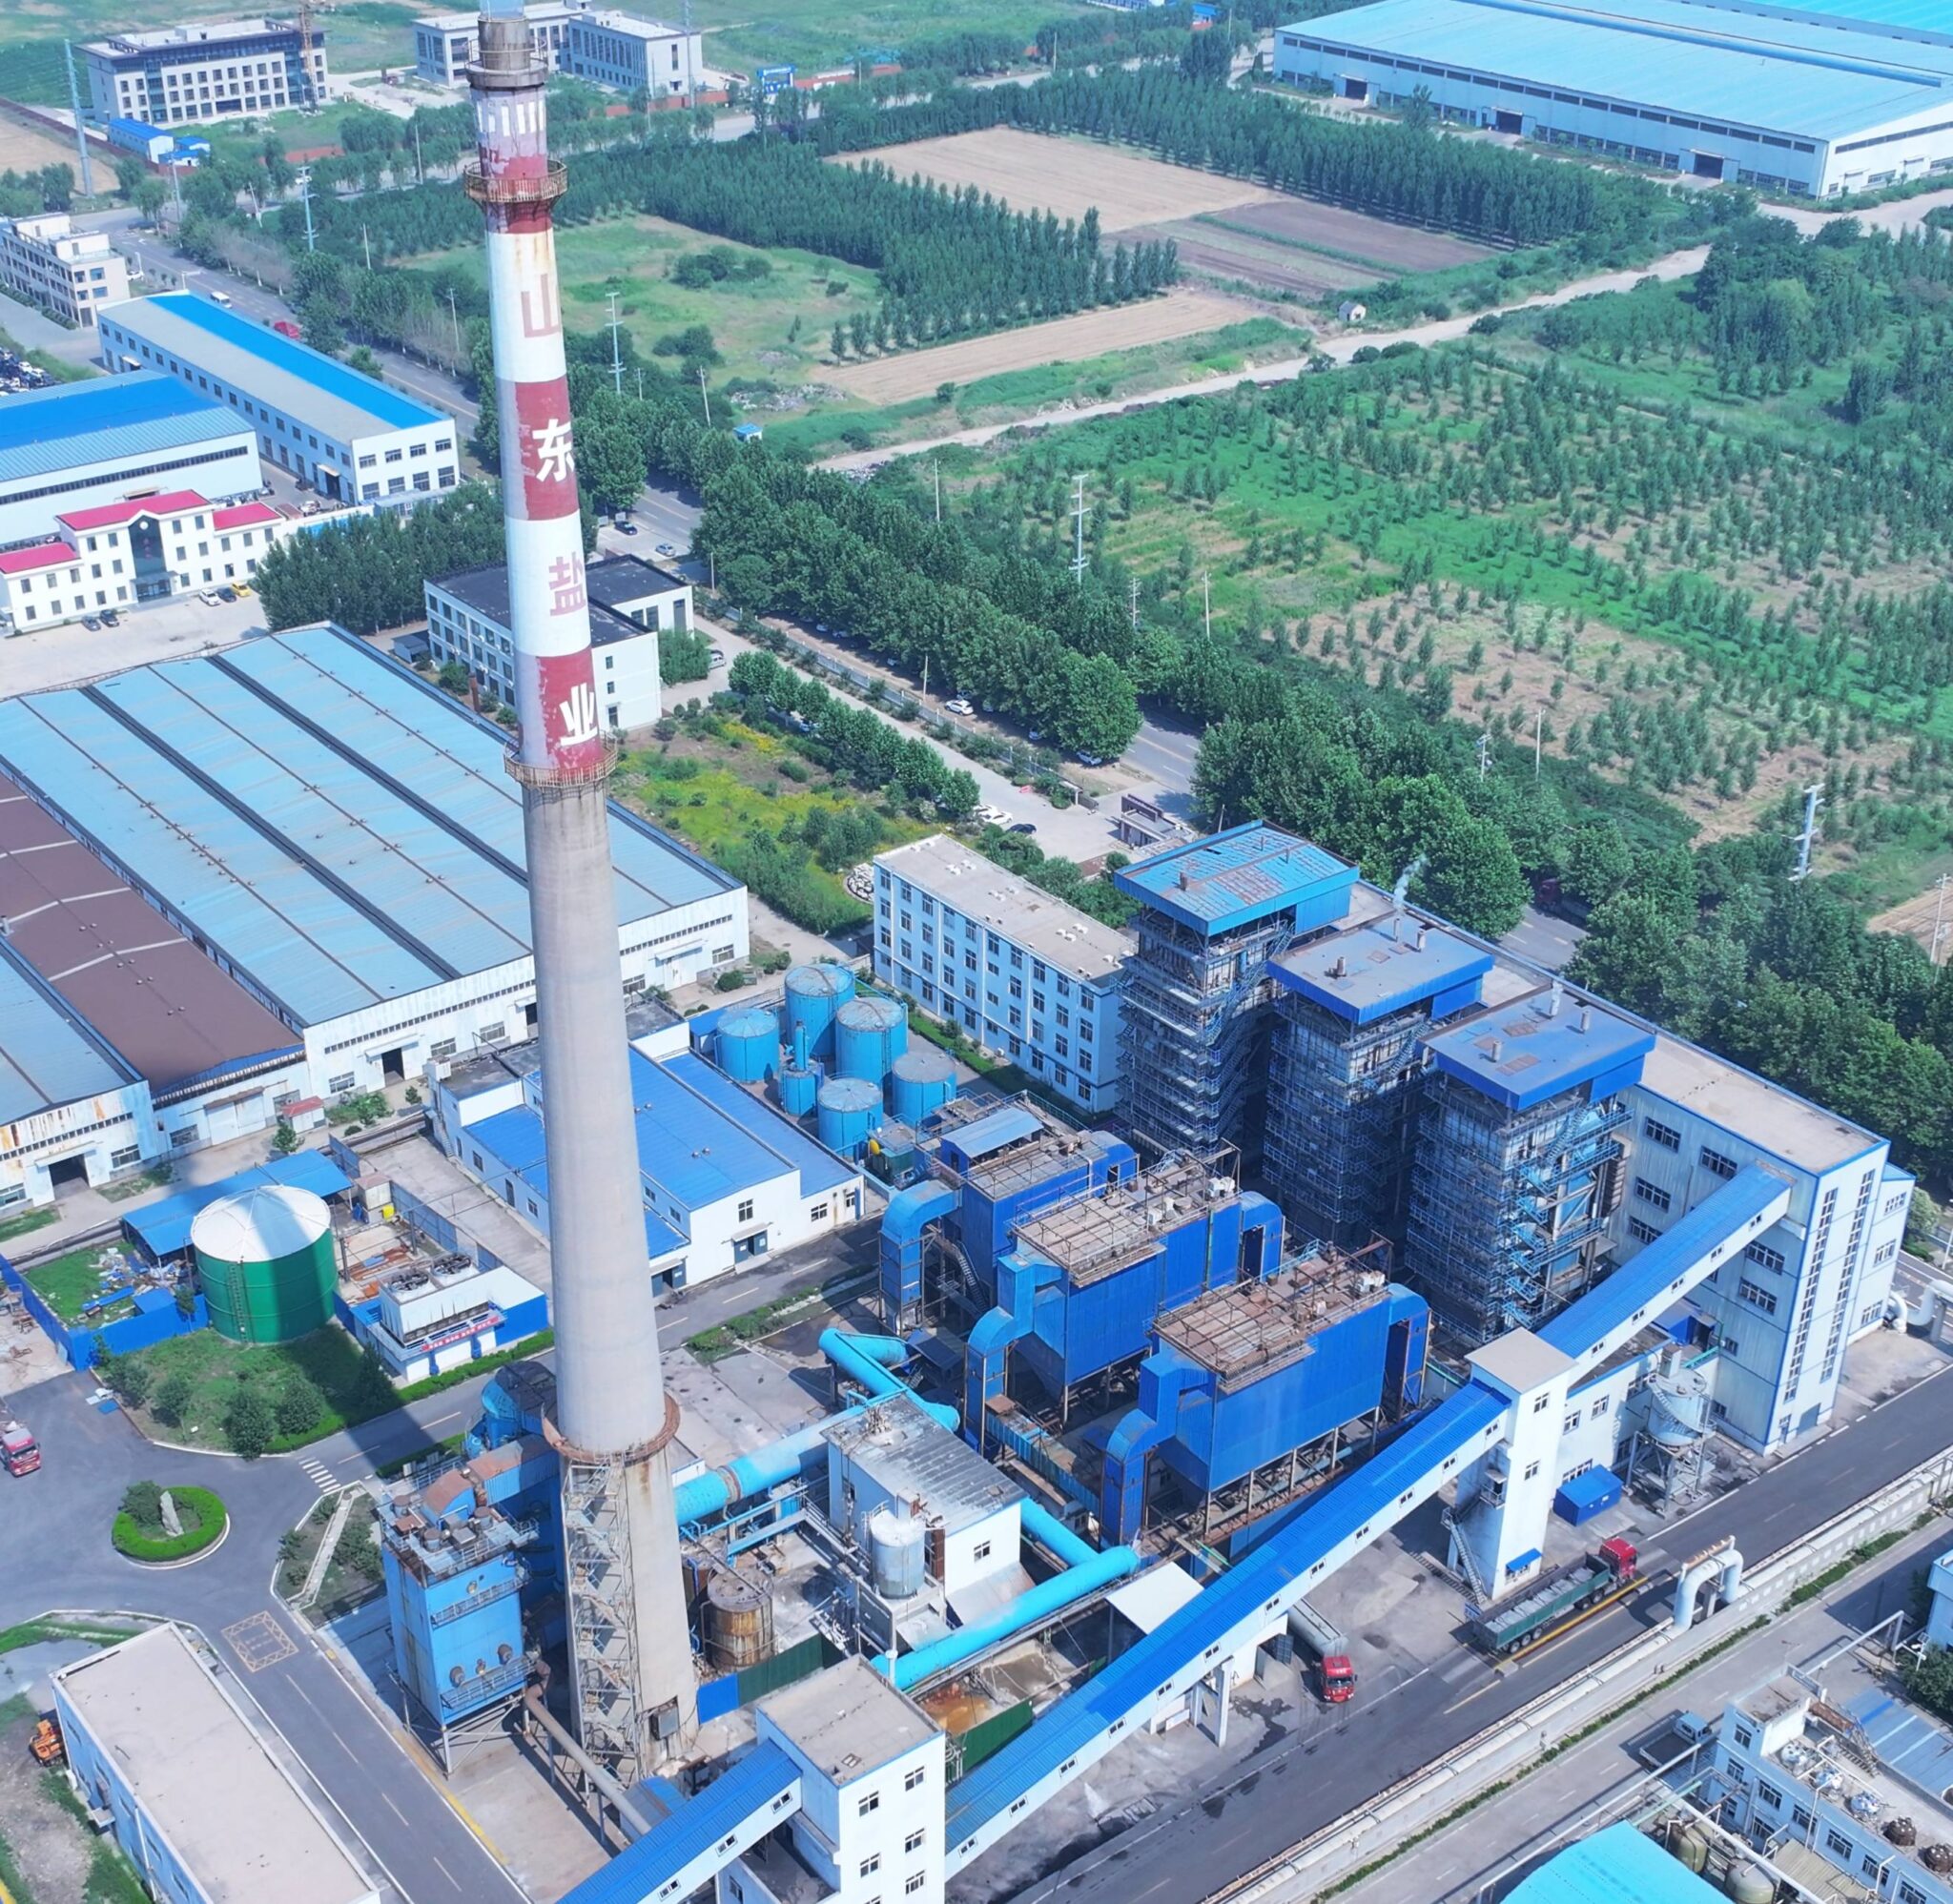
What Capital Costs Should Be Included in the Initial Investment for a CFB Boiler?
Circulating Fluidized Bed (CFB) boilers are complex, high-performance systems used in industrial and utility-scale power generation. While they offer excellent fuel flexibility and low emissions, they also demand significant upfront capital investment. Many project planners mistakenly focus only on the boiler unit price, underestimating the scope and scale of auxiliary equipment, civil works, and integration costs. For an accurate financial plan, it’s essential to fully account for all capital costs—including both boiler island and plant-wide infrastructure—to ensure budget realism and avoid mid-project funding gaps.
The capital costs that should be included in the initial investment for a CFB boiler comprise not just the boiler itself, but also auxiliary systems such as fuel feeding, bed material handling, ash removal, emissions control, water treatment, control and instrumentation, construction labor, and site preparation. These components typically represent 2 to 4 times the bare boiler price. A full-scope capital cost estimate ensures financial feasibility, smooth commissioning, and long-term system reliability.
Your boiler isn’t just a vessel—it’s an entire ecosystem. Budget accordingly.
The total capital investment for a CFB boiler system typically includes equipment, auxiliary systems, construction, and integration, not just the boiler unit itself.True
Over 60% of total CAPEX is usually spent on balance-of-plant infrastructure and installation.
📦 Comprehensive Capital Cost Components for CFB Boiler Projects
| Capital Component | Description | Typical Share of Total CAPEX |
|---|---|---|
| CFB Boiler Island | Combustion chamber, separators, cyclones, heat exchangers | 25–30% |
| Fuel Storage & Feeding Systems | Conveyors, bins, feeders for coal, biomass, petcoke | 10–15% |
| Bed Material Handling System | Sand or limestone storage, circulation, classifiers | 5–8% |
| Ash Handling System | Bottom/fly ash conveyors, crushers, silos | 5–10% |
| Flue Gas Cleaning | Baghouse, ESP, SNCR/SCR, desulfurization, ductwork | 10–15% |
| Feedwater Treatment System | Softening, demineralization, deaerator, blowdown | 5–7% |
| Boiler Controls & Instrumentation | SCADA, DCS, combustion analyzers, safety interlocks | 5–7% |
| Electrical & Cabling | Transformers, switchgear, MCC panels, power cabling | 3–5% |
| Civil Works & Foundations | Concrete pads, structural steel, foundations, crane systems | 10–15% |
| Installation & Piping | Mechanical assembly, pressure piping, insulation | 10–15% |
| Engineering & Permitting | FEED, environmental permits, 3D modeling, inspections | 3–6% |
All elements are critical—cutting corners at this stage creates costly retrofit risks.
🧮 Example: Capital Cost Estimate for a 150 MW CFB Boiler Project
| Item | Estimated Cost (USD) |
|---|---|
| Boiler Island (CFB core) | $28 million |
| Fuel Handling & Storage | $12 million |
| Bed & Ash Handling | $6.5 million |
| Emissions Control Equipment | $13 million |
| Feedwater Treatment | $5 million |
| Controls & Instrumentation | $6 million |
| Electrical, Cabling, Power Integration | $4.5 million |
| Civil Construction & Site Works | $9.5 million |
| Mechanical Installation | $8 million |
| Engineering, Permits, Contingencies | $5.5 million |
| Total Capital Investment | ~$98 million |
This aligns with average utility-scale project costs of $600–750/kW installed for CFB systems.
📊 Capital Cost Allocation Breakdown (%)
| Category | % of Total CAPEX |
|---|---|
| Boiler and Heat Recovery | 28% |
| Fuel/Ash/Bed Handling | 18% |
| Emissions & Air Quality | 13% |
| Electrical & Control | 9% |
| Water & Treatment | 6% |
| Civil & Construction | 14% |
| Engineering & Integration | 6% |
| Commissioning & Testing | 2% |
| Contingency | 4% |
Flue gas cleanup and fuel infrastructure often exceed boiler price in modern projects.
📋 Hidden Capital Cost Risks to Avoid
| Risk Factor | Impact on Budget |
|---|---|
| Undersized Ash Removal System | System clogging, emergency retrofits |
| Improper Civil Scope | Delays, cost overruns |
| Inadequate Emissions Design | Non-compliance, expensive retrofit |
| Poor Electrical Coordination | Start-up failure or transformer upgrades |
| Missing Redundancy | Boiler downtime due to system bottlenecks |
Overlooking auxiliary systems and integration costs leads to underbudgeting in more than 70% of new boiler projects.True
These non-boiler elements are essential to actual operation and commissioning.
Summary
The capital investment for a CFB boiler system goes far beyond the combustion chamber. It must include everything needed to store, handle, combust, control, clean, and safely operate the plant. Ignoring these auxiliary systems, integration efforts, and infrastructure costs results in budget overruns, project delays, and unsafe start-up conditions. With CAPEX typically ranging from $600–1,200 per kW installed, proper capital planning ensures financial and technical success. In high-stakes energy projects, what you don’t budget for can burn you later. Always build your numbers as carefully as you build your boiler.
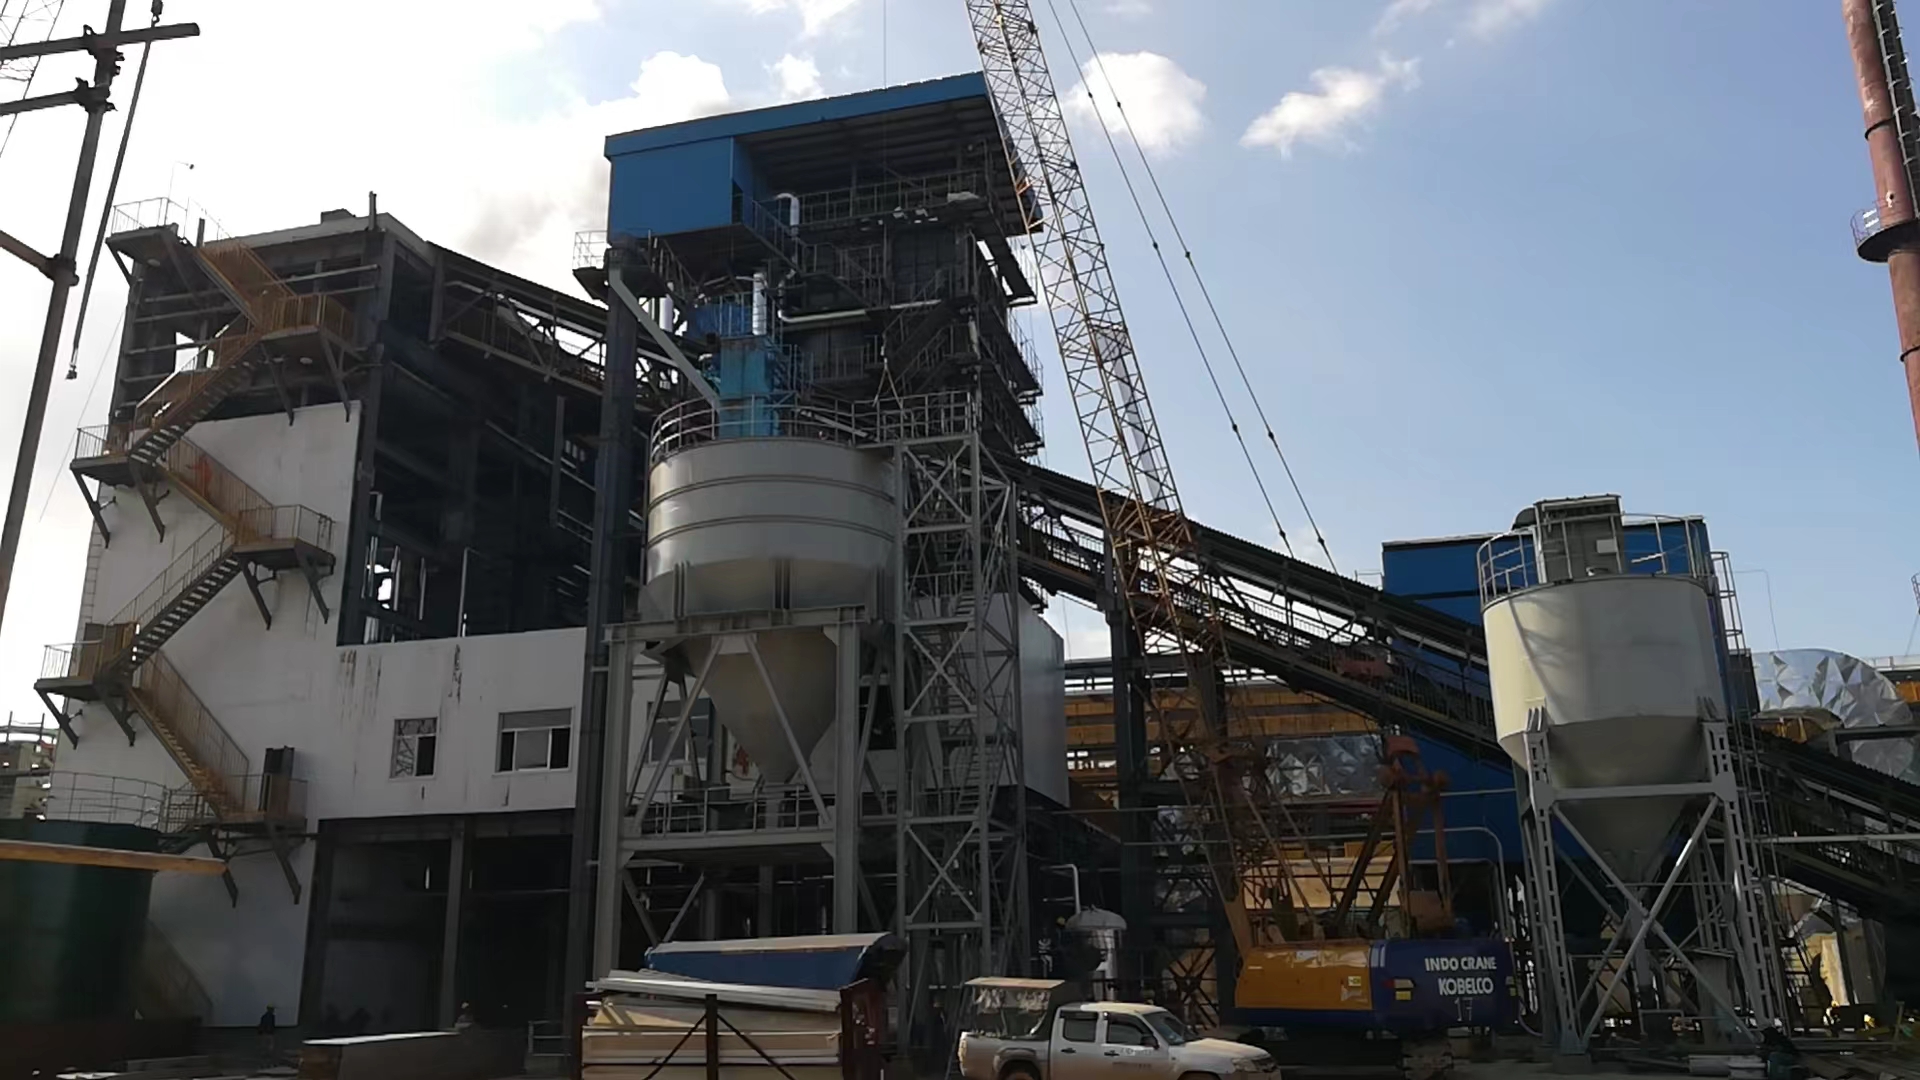
How Do Long-Term Fuel Type, Cost Variability, and Bed Material Affect Operational Expenses?
Circulating Fluidized Bed (CFB) boilers are favored for their fuel flexibility—handling coal, biomass, petcoke, and waste fuels with relative ease. This adaptability helps reduce dependency on a single fuel source and allows operators to respond to market pricing. However, these fuels vary widely in calorific value, ash content, moisture, and combustion behavior, which directly affect operational efficiency, emissions, and wear on components. Additionally, bed materials like silica sand or limestone, essential for combustion and emissions control, must be periodically replenished—creating another recurring operational cost. The right fuel strategy and bed management approach can mean the difference between profitability and budget overruns.
Long-term fuel type, cost variability, and bed material consumption significantly influence the operational expenses of a CFB boiler. Different fuels have unique costs, energy contents, and ash behaviors, which affect the amount of fuel required, fouling rates, and emissions control needs. Fuel price fluctuations introduce budgeting risk, while high-ash or low-grade fuels increase maintenance. Bed material, consumed continuously through abrasion and reaction with SO₂, adds a recurring expense tied to fuel quality and sulfur levels. Together, these variables can make up over 70% of total operating cost, demanding close monitoring and strategic procurement.
CFB boilers can burn anything—but not everything burns profitably.
Fuel type and bed material are the most significant ongoing cost drivers in CFB boiler operations.True
Fuel can account for over 60% of OPEX, while bed material use is tied to combustion chemistry and fuel sulfur content.
🔥 Common Fuel Types and Their Operational Characteristics
| Fuel Type | CV (kcal/kg) | Ash (%) | Moisture (%) | Sulfur Content | Cost Variability | Operational Challenges |
|---|---|---|---|---|---|---|
| Bituminous Coal | 5,000–6,500 | 10–15% | 5–10% | Medium | Moderate | Moderate ash, slag risk |
| Sub-bituminous | 3,500–5,000 | 15–30% | 10–25% | Low–Med | High | Slagging, higher bed loss |
| Biomass | 3,000–4,200 | 2–8% | 20–50% | Very Low | Very High | Corrosion, flame instability |
| Petcoke | 7,500–8,500 | 0.5–2% | <1% | High | Low | High SO₂, slagging risk |
| Waste-Derived | 2,000–4,000 | 20–40% | 15–35% | Variable | Unpredictable | Unburnables, high fouling |
Each fuel type impacts combustion efficiency, bed performance, and emissions control differently.
📊 Operational Expense Breakdown by Fuel Strategy (Example: 100 MW CFB Unit)
| Cost Component | High-Grade Coal | Mixed Biomass/Coal | 100% Biomass |
|---|---|---|---|
| Fuel Cost ($/MWh) | $22 | $18 | $28 |
| Bed Material ($/MWh) | $1.5 | $2.2 | $3.0 |
| Emissions Handling | $2.0 | $2.5 | $2.8 |
| Maintenance & Cleaning | $3.5 | $4.0 | $5.5 |
| Total OPEX ($/MWh) | $29 | $26.7 | $39.3 |
Biomass appears cheaper by fuel cost per ton but often more expensive per MWh due to lower CV and higher maintenance.
🧪 Example: Fuel Switching and Bed Material Impact
| Scenario | 80% Coal / 20% Petcoke | 100% Biomass |
|---|---|---|
| Fuel Price ($/ton) | $85 | $50 |
| Calorific Value (avg) | 6,700 kcal/kg | 3,500 kcal/kg |
| Fuel Use (tons/day) | 600 | 1,000 |
| Bed Material Use (tons/day) | 3.5 | 5.8 |
| Bed Material Cost ($/ton) | $150 | $150 |
| Daily Bed Cost | $525 | $870 |
| Flue Gas SO₂ | Medium (needs limestone) | Low |
| Maintenance Frequency | Standard | 30% higher |
Fuel savings on paper can disappear when adjusted for combustion efficiency and bed usage.
📦 Bed Material as a Recurring Cost Driver
| Bed Material Role | Cost Influence |
|---|---|
| Sand (Inert) | Abrades over time → replenishment needed |
| Limestone (Reactive) | Combines with SO₂ → spent after reaction |
| Attrition Loss | Adds 0.2–0.5% loss per hour |
| Contaminant Build-Up | Causes bed deactivation over time |
| Unburned Fuel Interaction | Increases fouling or agglomeration |
| Operating Parameter | Typical Value |
|---|---|
| Bed Consumption Rate | 1.5–2.5 kg/MWh |
| Bed Cost Range | $100–200/ton |
| Total Bed Cost (20 MW Plant) | $300,000–500,000/year |
CFB boiler bed material consumption increases with high-ash or high-sulfur fuels.True
Ash erodes particles and sulfur reacts with limestone, requiring more frequent bed makeup.
📈 Fuel Price Volatility Risk – Forecast Model
| Fuel Type | Historic Price Range ($/ton) | Standard Deviation | Notes |
|---|---|---|---|
| Imported Coal | $70 – $130 | Medium (±15–20%) | Tied to global market |
| Biomass Chips | $40 – $95 | High (±30–40%) | Seasonal, moisture-dependent |
| Petcoke | $50 – $70 | Low (±10%) | Stable, refinery-linked |
| RDF (waste) | Highly Variable | Very High (>50%) | Local sourcing, disposal fees |
LCCA must include price projections and fuel switching scenarios to prepare for volatility.
Summary
The long-term economics of a CFB boiler depend heavily on fuel type, cost variability, and bed material behavior. While CFB technology offers unmatched flexibility in fuel choice, each option carries unique operational implications—impacting combustion efficiency, emissions, bed replacement frequency, and maintenance cost. Understanding these variables and modeling their long-term impact is essential for accurate budgeting, risk management, and profitability. In fluidized bed systems, it’s not just what you burn—it’s how predictably and cleanly you can keep burning it over decades.
What Are the Routine Maintenance, Refractory Repair, and Ash Handling Costs?
Circulating Fluidized Bed (CFB) boilers are advanced combustion systems designed for fuel flexibility and low emissions. However, their unique operating conditions—such as high turbulence, high-velocity solids flow, and high-temperature combustion—place intense mechanical and thermal stress on internal components. This leads to routine maintenance demands, particularly for refractory linings and ash handling equipment, which are more extensive than in conventional boiler systems. These costs, if underestimated, can quickly erode operational budgets and reduce the boiler’s return on investment.
Routine maintenance, refractory repair, and ash handling costs for a CFB boiler are substantial and recurring, typically accounting for 15–30% of total O&M expenses. Routine maintenance includes mechanical inspections, fan servicing, fluidization system upkeep, and actuator recalibration. Refractory repair is required every 1–3 years due to erosion and spalling in high-stress areas like cyclones, seal pots, and furnace walls. Ash handling costs depend on fuel ash content, system design, and disposal method, ranging from $3 to $12 per ton of ash. Together, these activities ensure reliable performance, prevent unplanned outages, and sustain thermal efficiency.
In a CFB boiler, maintenance is not optional—it’s the price of high-performance combustion.
CFB boilers incur higher routine maintenance and refractory repair costs than conventional boilers due to abrasive bed materials and complex flow patterns.True
The circulating solids and thermal gradients erode refractory and wear components faster, requiring specialized upkeep.
🔧 Routine Maintenance Cost Components
| Maintenance Activity | Frequency | Typical Annual Cost (USD) |
|---|---|---|
| Mechanical Inspections (Fans, Ducts, Pumps) | Monthly/Quarterly | $100,000 – $200,000 |
| Control System Calibration | Semi-Annually | $15,000 – $40,000 |
| Soot Blowing Equipment Service | Quarterly | $20,000 – $50,000 |
| Bed Pressure Control Checks | Monthly | $8,000 – $25,000 |
| Valve/Actuator Repair | Quarterly/Annually | $20,000 – $45,000 |
| Instrumentation Replacement | Annual | $10,000 – $30,000 |
Total routine maintenance costs typically range from $180,000 to $400,000 per year, depending on boiler size and load profile.
🧱 Refractory Repair and Replacement Costs
| Zone/Component | Refractory Type | Repair Cycle | Cost per Event (USD) |
|---|---|---|---|
| Furnace Sidewalls and Roof | Castable or brick lining | 2–3 years | $120,000 – $250,000 |
| Cyclone Separators | High-dense castable | 1–2 years | $180,000 – $300,000 |
| Seal Pots and Loop Seals | Abrasion-resistant castables | 1–2 years | $40,000 – $90,000 |
| Ash Coolers and Chutes | Silicon carbide tiles | 2–4 years | $30,000 – $70,000 |
| Start-up Burners, Windbox | Insulating castables | 2–3 years | $15,000 – $40,000 |
Refractory work usually requires 1–2 weeks of downtime, planned during annual shutdowns.
📦 Ash Handling Costs and Key Drivers
| Cost Element | Unit Cost / Estimate | Notes |
|---|---|---|
| Bottom Ash Conveyor Maintenance | $15,000 – $40,000/year | Chains, motors, idlers |
| Fly Ash Collector/Baghouse Service | $25,000 – $60,000/year | Bag replacements every 3–4 years |
| Ash Transport & Trucking | $5 – $10 per ton | Depending on distance and vendor |
| Ash Disposal / Landfill Fee | $10 – $25 per ton | May vary with local regulations |
| Ash Conditioning (moisture/odor) | $5,000 – $15,000/year | Especially with biomass/waste fuels |
| Parameter | Value (typical) |
|---|---|
| Ash Production Rate | 5–20% of fuel input |
| Annual Ash Volume | 6,000–20,000 tons |
| Annual Handling Cost | $80,000 – $300,000+ |
Ash handling costs scale with fuel ash content and local disposal regulations.True
High-ash fuels or limited landfill access raise transport and tipping fees significantly.
📊 Annual O&M Cost Estimate Breakdown (Example: 100 MW CFB Boiler)
| Category | Annual Cost (USD) |
|---|---|
| Routine Maintenance | $250,000 |
| Refractory Repairs | $180,000 |
| Ash Handling & Disposal | $220,000 |
| Total Annual Cost (est.) | ~$650,000 |
Over a 20-year life: ~$13 million in maintenance-related costs, not including unexpected shutdowns.
📋 Ways to Reduce Maintenance and Ash Costs
| Optimization Approach | Impact |
|---|---|
| Use low-ash fuels or blending | Reduces ash handling and disposal |
| Install wear-resistant linings | Extends refractory life |
| Implement predictive diagnostics | Avoids premature refractory failure |
| Automate ash extraction systems | Reduces labor and spillage loss |
| Contract disposal at fixed rates | Shields against landfill cost hikes |
A proactive maintenance strategy always costs less than reactive emergency repairs.
Summary
Routine maintenance, refractory repair, and ash handling are non-negotiable operational costs in the lifecycle of a CFB boiler. While the technology offers superior flexibility and efficiency, it demands regular attention due to its abrasive, high-temperature environment. These costs—ranging from $500,000 to $1 million annually depending on boiler size and fuel mix—must be factored into all lifecycle and profitability models. Reliable CFB performance doesn’t come free—it comes from consistent, intelligent investment in upkeep.
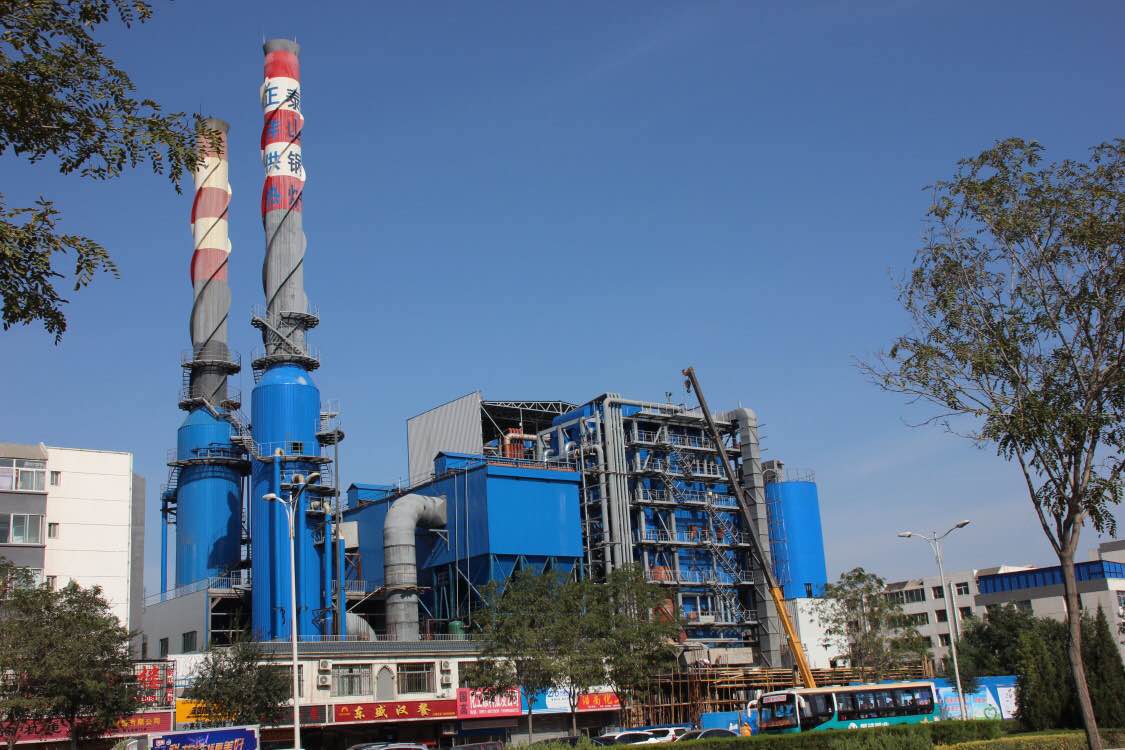
How Do Emissions Compliance and Environmental Equipment Impact Lifecycle Costs?
Circulating Fluidized Bed (CFB) boilers are well-known for their ability to burn low-grade fuels with relatively low emissions—but they are not immune to environmental regulations. In fact, because they often handle high-ash, high-sulfur, and variable fuels, robust emissions control systems are mandatory for compliance with stringent air quality standards. These systems—including baghouses, SNCR/SCR systems, limestone injection for SO₂ control, and CEMS (Continuous Emissions Monitoring Systems)—not only add to upfront capital costs, but also drive significant operational and maintenance expenses over the boiler’s lifecycle.
Emissions compliance and environmental equipment significantly impact the lifecycle costs of a CFB boiler by adding both capital investment and recurring operating costs. Regulatory compliance requires advanced control systems such as baghouses, lime or limestone injection, ammonia dosing, SNCR or SCR units, and CEMS. These systems demand regular reagent input, equipment maintenance, emissions monitoring, and reporting. Over a 20–30 year boiler life, emissions-related costs can represent 15–25% of total lifecycle operational expenses, particularly under tightening environmental regulations and carbon pricing frameworks.
Compliance isn’t optional—and in CFB operation, it’s an investment with long-term financial consequences.
Emissions control and environmental compliance account for up to a quarter of total lifecycle operational costs in CFB boilers.True
These systems require continuous inputs, maintenance, and upgrades to meet evolving standards.
🏭 Required Emissions Control Equipment for CFB Boilers
| Pollutant Controlled | Equipment Type | Notes |
|---|---|---|
| SO₂ | Limestone injection, semi-dry scrubber | Tied to sulfur content of fuel |
| NOₓ | SNCR (Urea/Ammonia), SCR | Depends on temp zones and compliance levels |
| Particulate Matter | Baghouse or Electrostatic Precipitator | Required for fine ash removal |
| CO & VOCs | Good combustion + CO monitors | Ensured via air-fuel tuning |
| CO₂ | Not controlled but taxed/regulated | Affects lifecycle cost via carbon pricing |
| HCl, HF, Hg | Activated carbon, sorbents (optional) | Required in some jurisdictions |
| CEMS | Continuous Emissions Monitoring System | Mandatory for most industrial permits |
🧮 Example: 150 MW CFB Boiler – Emissions Control Lifecycle Cost Model (20 Years)
| Equipment/Service | CAPEX (USD) | OPEX (20-Year) | Notes |
|---|---|---|---|
| Baghouse & Ductwork | $8.5 million | $3.5 million | Bag replacement every 3–5 years |
| SNCR System (Ammonia/Urea + Injectors) | $3.2 million | $3.2 million | Reagent cost: $80,000–$180,000/yr |
| Limestone Injection + Storage | $2.5 million | $5.8 million | Limestone use depends on SO₂ load |
| CEMS (O₂, CO, NOₓ, SO₂) | $750,000 | $1.1 million | Annual calibration + data validation |
| Emissions Permitting & Reporting | — | $400,000 | Includes lab tests, audits |
| Carbon Tax/Offset (Optional) | — | $3–10 million | Based on CO₂ tonnage and local policy |
| Total Emissions Lifecycle Cost | $14.95M | $17.9M–$25M | $32.8M–$40M over 20 years |
These figures represent 20–30% of total lifecycle costs in most LCCA models for CFB units.
📊 Emissions Compliance Cost Breakdown by Type (% of Emissions Budget)
| Compliance Component | % of Emissions LCCA Cost |
|---|---|
| Baghouse & Particulate Control | 20–25% |
| NOₓ Control (SNCR/SCR) | 15–20% |
| SO₂ Control (Limestone) | 25–30% |
| Monitoring (CEMS) | 10–12% |
| Reporting & Permitting | 2–5% |
| Carbon Tax (if applicable) | 20–30% (varies) |
Most systems recurring costs exceed their installation costs within the first 8–12 years.
📦 Recurring Operational Costs for Emissions Systems
| System/Service | Typical Annual Cost (USD) |
|---|---|
| Baghouse Bags Replacement | $80,000 – $150,000 |
| SNCR Ammonia or Urea Reagent | $90,000 – $200,000 |
| Limestone Refill for SO₂ Capture | $150,000 – $400,000 |
| CEMS Calibration & Upkeep | $40,000 – $70,000 |
| Emissions Testing & Reporting | $20,000 – $60,000 |
| Total Annual Compliance Cost | $400,000 – $800,000 |
These figures vary by fuel sulfur/ash content, load factor, and regulatory environment.
📋 Risk Factors from Underestimating Compliance Costs
| Oversight | Consequence |
|---|---|
| Undersized limestone system | SO₂ violations, non-compliance fines |
| No SCR readiness | Inability to meet ultra-low NOₓ limits |
| Skipping CEMS maintenance | Permit suspension or revocation |
| Poor baghouse upkeep | PM exceedances and forced shutdowns |
| Ignoring carbon cost forecast | Surprise tax exposure, lost competitiveness |
Emissions non-compliance can result in fines, permit revocation, and shutdowns that outweigh all short-term savings.True
Modern regulations demand ongoing proof of performance; short-cutting control systems is financially reckless.
Summary
Emissions compliance and environmental equipment in CFB boilers are not just regulatory necessities—they are major contributors to capital and operating costs over the boiler’s lifecycle. From initial investments in baghouses and NOₓ/SO₂ controls to the recurring expenses of reagents, replacements, monitoring, and reporting, these systems consume 20–30% of long-term OPEX. As environmental rules tighten and carbon pricing expands, emissions-related costs will continue to grow. Accurately modeling these impacts in lifecycle cost analysis ensures financial sustainability and uninterrupted plant operation. In the world of modern boiler investment, compliance isn’t a cost—it’s the cost of staying in business.
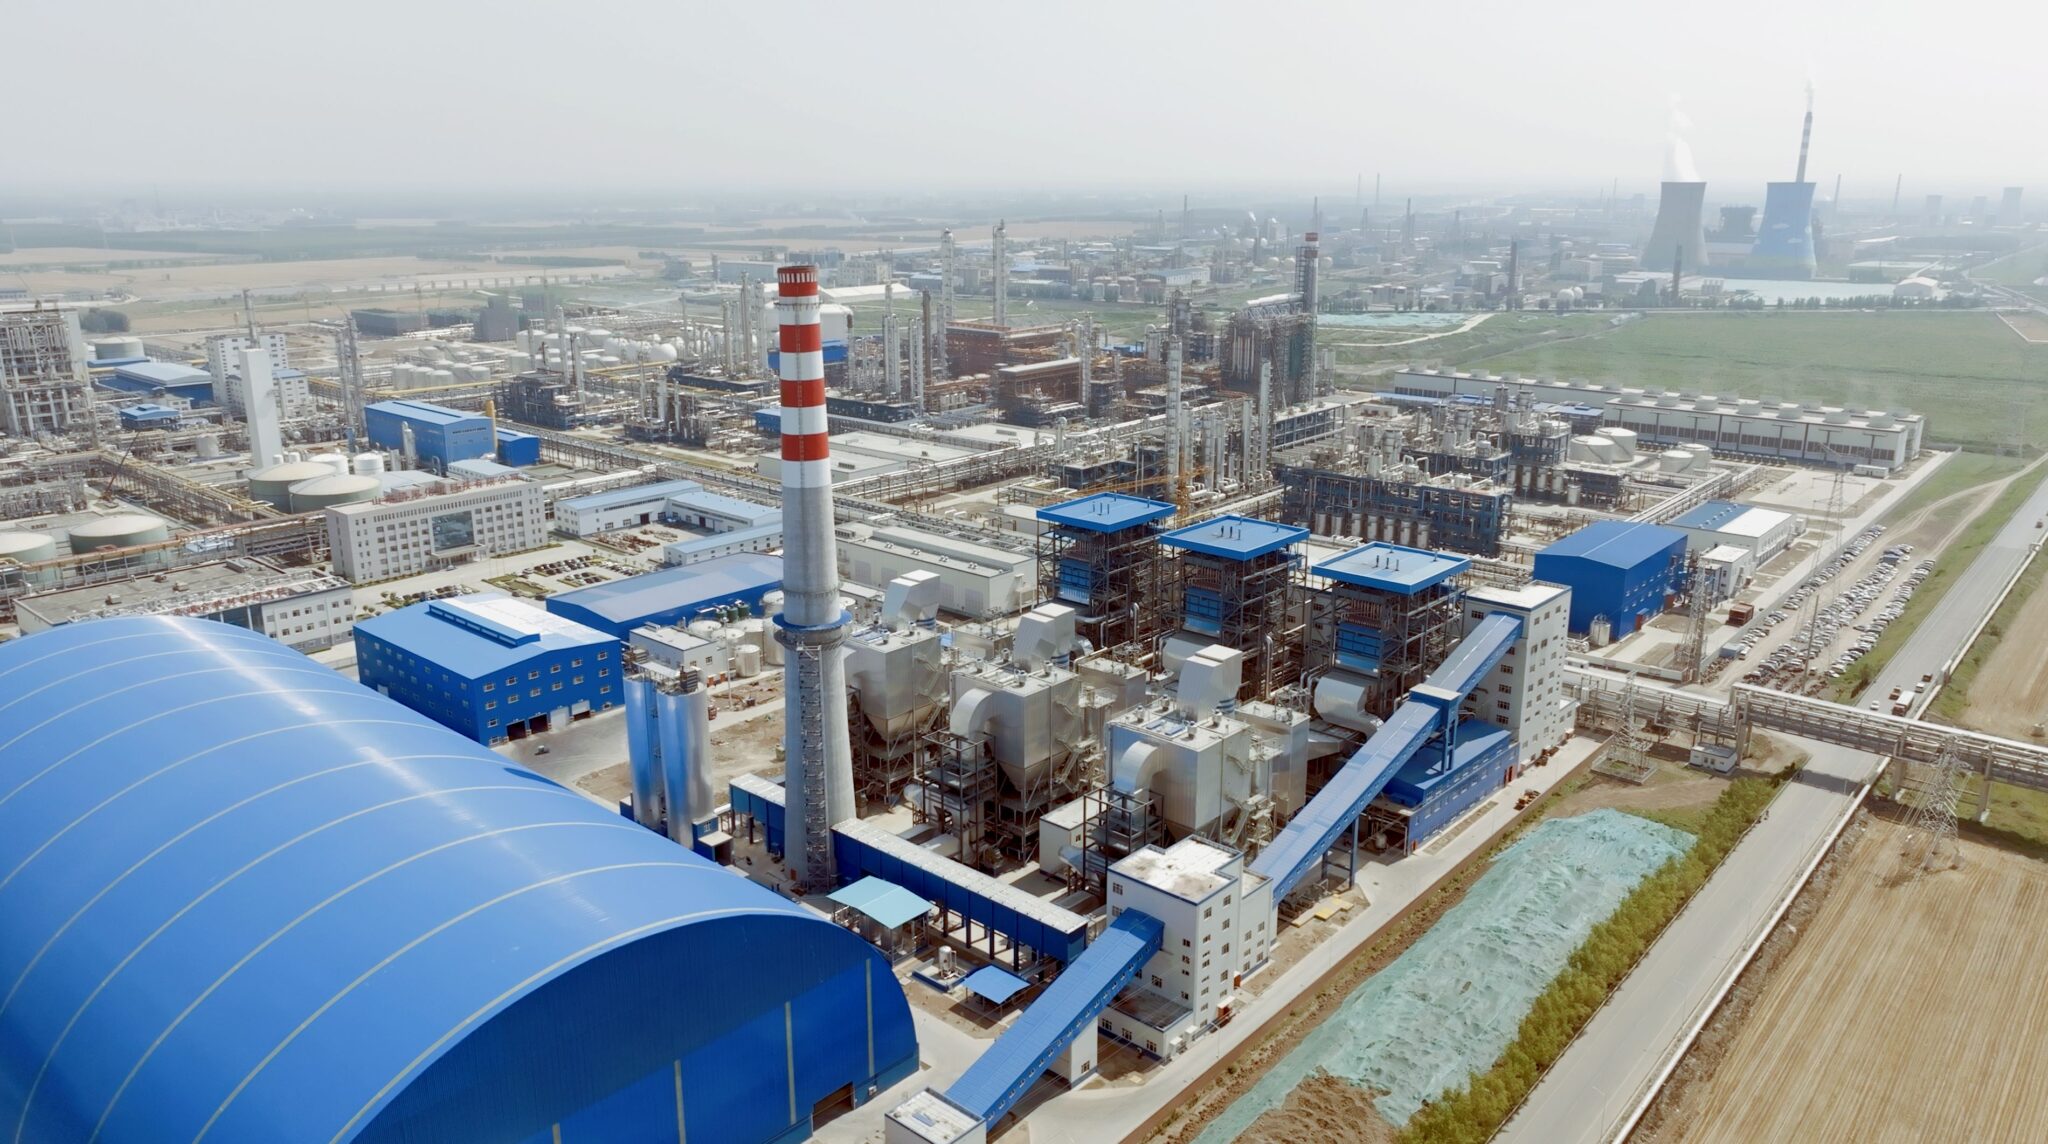
How Can You Calculate TCO, ROI, and Payback Period Using LCCA Methodology?
Investing in a Circulating Fluidized Bed (CFB) boiler requires more than comparing purchase prices. These systems carry long-term obligations including fuel, maintenance, emissions, labor, and auxiliary system costs. Lifecycle Cost Analysis (LCCA) allows project developers and energy managers to evaluate total financial performance—not just the capital cost. With LCCA, you can calculate Total Cost of Ownership (TCO), Return on Investment (ROI), and Payback Period, offering a clear, quantifiable view of long-term feasibility and risk.
To calculate TCO, ROI, and Payback Period using LCCA methodology for a CFB boiler, you must model all relevant capital and operating costs across the system’s life—typically 20–30 years. TCO is the total of all expenses; Payback Period is the time it takes to recoup the capital investment via operational savings; ROI measures total profit generated over the life relative to investment. These metrics allow accurate comparisons with alternative technologies and validate the business case for high-efficiency, fuel-flexible CFB systems.
Financial clarity is the foundation of confident energy investment.
TCO, ROI, and Payback Period calculations using LCCA give investors a full-spectrum view of CFB boiler financial viability.True
These metrics account for both up-front and long-term costs, including fuel, maintenance, and environmental compliance.
🧾 Step 1: Calculate Total Cost of Ownership (TCO)
Formula (simplified expression):
TCO = Capital Costs + ∑(Annual OPEX over life)
OPEX includes:
Fuel
Bed material
Maintenance & repairs
Ash handling
Water treatment
Emissions compliance
Labor & downtime
Insurance and permitting
Decommissioning (if applicable)
📊 Example – 100 MW CFB Boiler (20-Year Model)
| Component | Cost (USD) |
|---|---|
| CAPEX (Installed) | $80 million |
| Fuel (20 years) | $140 million |
| Maintenance & Refractory | $15 million |
| Bed Material & Ash Handling | $10 million |
| Emissions Control (O&M) | $16 million |
| Labor & Water Treatment | $8 million |
| Total TCO (20 Years) | $269 million |
The TCO represents the true cost of ownership, not just installation.
🧮 Step 2: Calculate Payback Period
Formula (simplified expression):
Payback Period = Initial CAPEX / Annual Savings
📋 Example Comparison – CFB vs. Pulverized Coal Boiler
| Metric | CFB Boiler | Pulverized Coal Boiler |
|---|---|---|
| CAPEX | $80 million | $70 million |
| Annual OPEX | $9.45 million | $11.2 million |
| Annual Savings (vs. PC) | $1.75 million | — |
Payback Period = $80M / $1.75M = **~4.6 years**
After this period, fuel and O&M savings turn into financial gain.
📈 Step 3: Calculate Return on Investment (ROI)
Formula (simplified expression):
ROI = (Total Net Savings over Life – Initial Investment) / Initial Investment × 100%
Total Net Savings = Difference in OPEX vs. baseline option (e.g. PC boiler) × lifespan
📊 Example – 20-Year Period
| Item | Value (USD) |
|---|---|
| Initial CAPEX | $80 million |
| Total OPEX (CFB) | $189 million |
| Total OPEX (PC Boiler) | $224 million |
| Net Savings over 20 Years | $35 million |
ROI = ($35M – $80M) / $80M × 100% = **–56.25% (loss if only savings considered)**
Now include electricity revenue or cost avoidance:
| Electricity Revenue over 20 years | $350 million |
| Net Profit (Revenue – TCO) | $81 million |
Adjusted ROI = $81M / $80M × 100% = **~101%**
Realistic ROI includes both cost avoidance and revenue generation.
📋 Key Inputs for Accurate LCCA Modeling
| Variable | Importance |
|---|---|
| Fuel cost forecasts | Impacts 50–60% of OPEX |
| Operating hours (load factor) | Drives fuel and wear-and-tear |
| Discount rate (for NPV) | Converts future costs to present value |
| Ash content and sulfur level | Affects bed and emissions cost |
| Carbon pricing assumptions | Alters OPEX in future years |
Accurate ROI and TCO calculations for CFB boilers require modeling fuel variability, emissions, and O&M over at least 20 years.True
Ignoring long-term costs or regulatory changes skews investment decision accuracy.
📊 Financial Metrics Snapshot: 100 MW CFB Boiler (20-Year)
| Metric | Value |
|---|---|
| Total CAPEX | $80 million |
| Total OPEX | $189 million |
| Total TCO | $269 million |
| Total Revenue (power sales) | $350 million |
| Net Profit | $81 million |
| ROI | 101% |
| Payback Period | ~4.6 years |
A well-managed CFB project becomes financially net-positive within 5 years.
Summary
Lifecycle Cost Analysis (LCCA) provides the financial foundation for any major boiler investment—and for CFB systems in particular, it helps quantify the long-term value of fuel flexibility, emissions performance, and efficiency. By calculating Total Cost of Ownership (TCO), Return on Investment (ROI), and Payback Period, plant developers and investors can make informed, data-backed decisions that account for both cost and risk. In the energy sector, the smartest boiler isn’t just efficient—it’s financially sound for 20 years or more. LCCA is how you find it.
🔍 Conclusion
Performing a lifecycle cost analysis for a CFB boiler ensures that decision-makers look beyond initial capital expenditure and understand the long-term financial and operational implications of the investment. While CFB systems may involve higher upfront costs, they often deliver superior value through lower emissions penalties, multi-fuel capability, and long-term operating efficiency. A well-executed LCCA allows for smarter, data-driven investment decisions in today’s cost- and carbon-conscious energy landscape.
📞 Contact Us
💡 Need help evaluating your CFB boiler project? Our team specializes in lifecycle cost modeling, emissions forecasting, and customized ROI analysis for industrial and utility-scale CFB systems.
🔹 Let us help you build a cost-effective, fuel-flexible, and future-ready CFB boiler solution! 🔄🔥📊
FAQ
What is a lifecycle cost analysis (LCCA) for a CFB boiler?
Lifecycle cost analysis (LCCA) is a method to evaluate the total cost of ownership (TCO) of a CFB boiler over its operational lifespan, usually 20–30 years. It includes capital costs, fuel expenses, maintenance, emissions compliance, labor, and decommissioning. This helps assess the boiler’s long-term financial viability.
What are the key components of LCCA for a CFB boiler?
Capital Cost – Boiler equipment, installation, fuel handling, and control systems
Fuel Cost – Annual consumption of coal, biomass, or RDF, and fuel price variability
O&M Costs – Routine maintenance, bed material replacement, cyclone upkeep
Emissions Control – SO₂, NOx, and PM compliance equipment and operating costs
Labor & Training – Skilled operator staffing for CFB-specific systems
End-of-Life Costs – Decommissioning, disposal, and potential boiler replacement
How do you calculate fuel cost in a CFB boiler lifecycle analysis?
Annual Fuel Cost = Annual Fuel Consumption (tons) × Fuel Price ($/ton)
Fuel flexibility allows CFB boilers to use low-cost or waste fuels. For example:
Coal: $40–$60/ton
Biomass: $30–$80/ton
Petcoke/RDF: $20–$50/ton
Fuel mix and moisture content affect consumption rates and must be factored into total cost projections.
What are typical long-term maintenance costs for a CFB boiler?
Annual maintenance ranges from 4–7% of the capital cost, covering:
Cyclone separator upkeep
Refractory lining and tube erosion control
Bed material management and ash handling
Over a 20–25 year lifespan, O&M costs can exceed $500,000–$2 million, depending on boiler size and fuel type.
Why is LCCA important when choosing a CFB boiler?
Though CFB boilers have higher initial costs than traditional boilers, their ability to use low-cost, varied fuels and meet strict environmental standards often leads to lower TCO. LCCA provides clarity when comparing CFB to other boiler technologies, especially for long-term planning, energy budgeting, and sustainability goals.
References
LCCA Guidelines for Energy Systems – DOE – https://www.energy.gov
Cost Structure of Circulating Fluidized Bed Boilers – https://www.sciencedirect.com
Fuel Flexibility and Economics in CFB Systems – https://www.researchgate.net
IEA Report on CFB Boiler Cost Efficiency – https://www.iea.org
Emissions Control Equipment for CFB Boilers – https://www.epa.gov
Boiler O&M and Lifecycle Planning – https://www.mdpi.com
Cost Benefits of Multi-Fuel CFB Technology – https://www.bioenergyconsult.com
Advanced CFB Boiler Financial Modeling Tools – https://www.automation.com
Capital vs. Operational Cost in Boiler Systems – https://www.energysavingtrust.org.uk
ASME Standards for High-Efficiency Boiler Systems – https://www.asme.org

